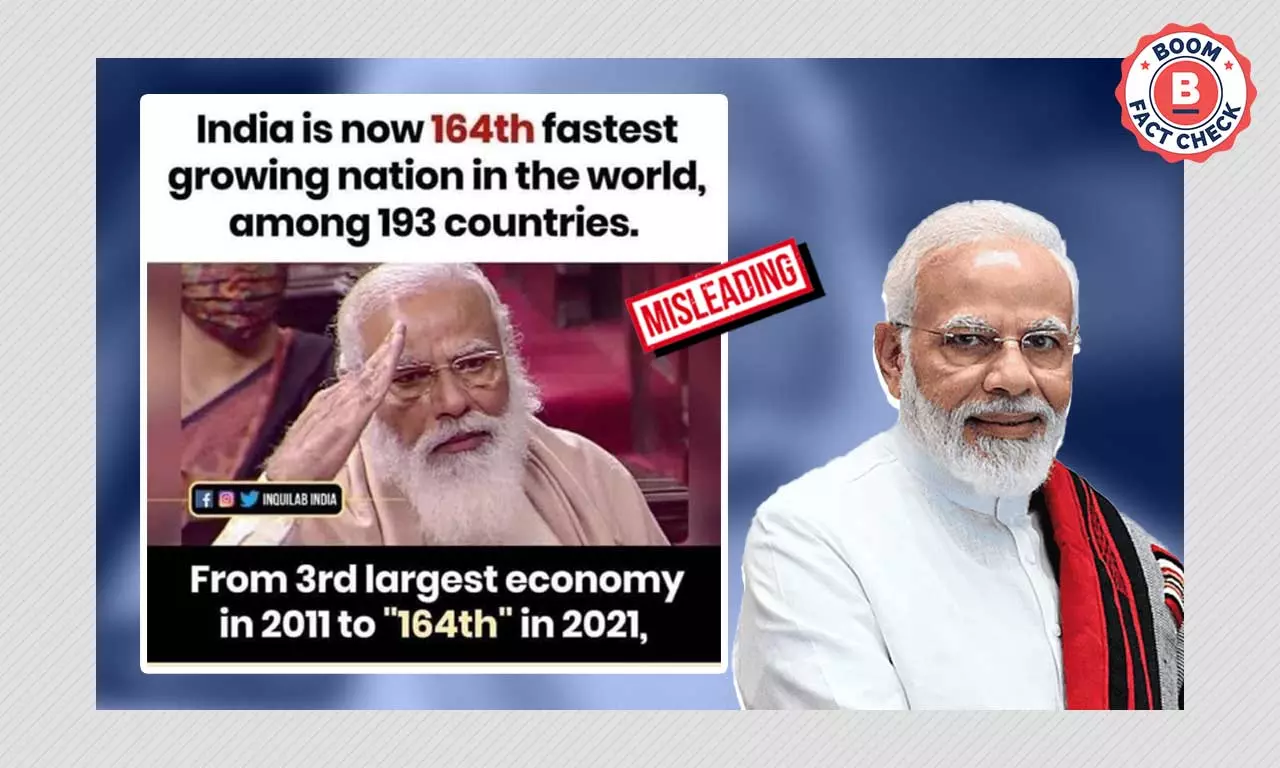
A graphic misleadingly compares India's economic size to its economic growth rate to convey the economy being in bad shape
By: Mohammed Kudrati
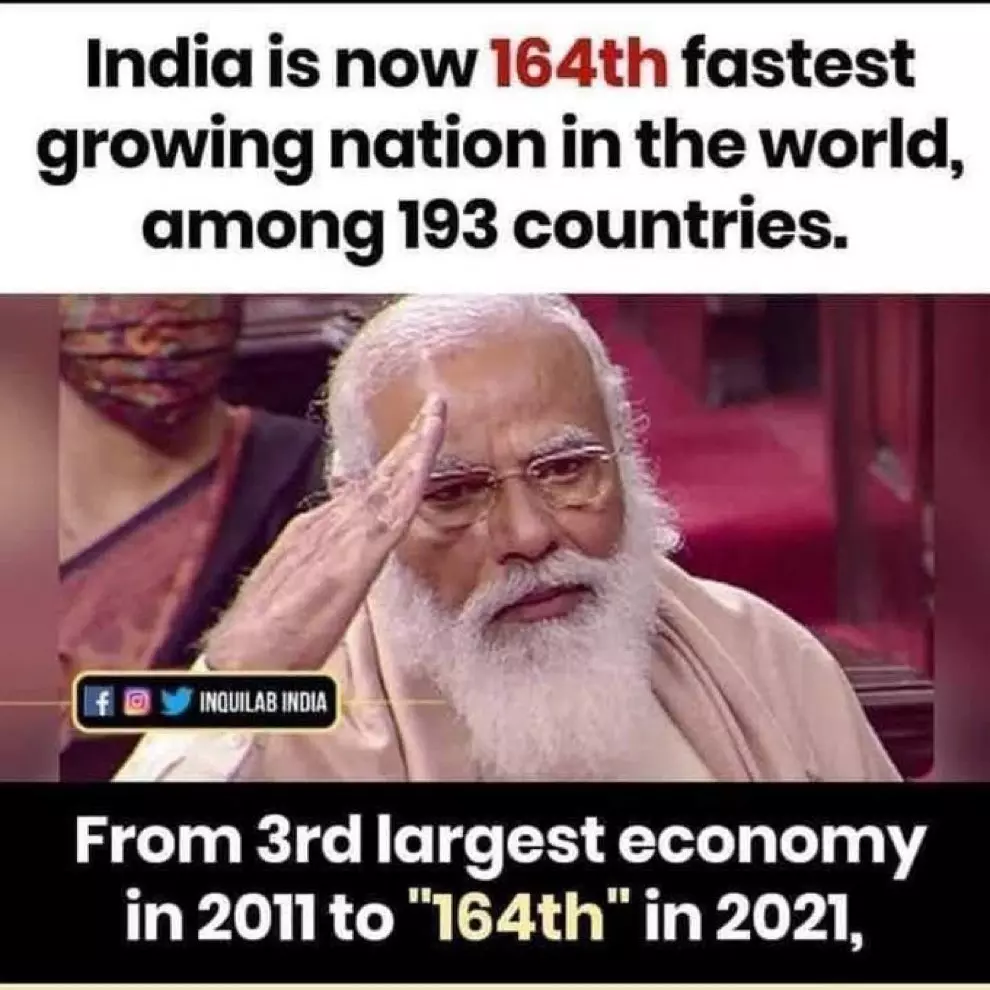
A viral graphic stating that India has fallen from the third largest economy in the world in 2011 to the 164th fastest growing economy out of 193 countries in 2021, is misleading.
This is due to two reasons. First, the graphic makes an apple to oranges comparison as it compares India's position in economic size to its position in economic growth.
Second, the yardsticks used to measure them differ. The graphic measures economic size in purchasing power parity (PPP) (Claim: India is the third largest economy) while growth is measured in terms of constant prices (Claim: India is the 164th fastest growing economy). These are two separate ways to value an economy.
In terms of growth: India was the third largest economy in the world in 2011 and remains so in terms of PPP, following China and the United States, according to data from the World Bank
In terms of size: The Indian economy contracted in 2020, when the first wave of the COVID-19 pandemic struck, and from where this ranking is according to the International Monetary Fund (IMF). However, it has improved considerably in its latest estimates, to the world's fastest growing large economy.
However, the numbers and ranking used in the claim at face value are correct, the data show.
This graphic can be seen below.
It was recently shared by Bharatiya Janata Party leader and former Member of Parliament and Union Minister Subramanian Swamy. However, he does clarify in a tweet that he is referring to PPP numbers.
pic.twitter.com/skhxhAcMQk— Subramanian Swamy (@Swamy39) July 11, 2022
This graphic, however, is not new, and has been shared several times before and by others too.
Salute to Modi Ji. He is doing wonderful work! Love you sir!👏🌹 pic.twitter.com/sF0o0PlWtf— KRK (@kamaalrkhan) July 11, 2022
From 3rd largest economy in 2011 to 164th in 2021 👇
FactCheck
1. What is PPP?
Each country reports data in their own currency. Therefore, according to the IMF, answering questions requiring international comparison like ....Where is the average person better off?
Which country contributes the most to global growth?
... becomes more difficult. One of the ways to solve this problem is by using purchasing power parity.
Officially, it is defined as:
The rate at which the currency of one country would have to be converted into that of another country to buy the same amount of goods and services in each country.
-The IMF
A popular and lighthearted example of the PPP is illustrated by the Economist magazine, through their 'Big Mac Index', as the Big Mac burger, served by the fast-food chain McDonald's, is sold globally and is a nearly identical good. They explain that a Big Mac costs $5 in the United States but 20 yuan in China, establishing a PPP exchange rate between US and China being 1 dollar to 4 yuan if only Big Macs are considered.
In reality, instead of a Big Mac, more established measures to obtain the PPP exchange rate are used by United Nation's International Comparison Program, measuring broader basket of goods and services. The PPP exchange rate can then be used to express the size of an economy in terms of another currency (usually international US dollars) based on the same basket of goods and services.
By this measure, India has the third largest economy according to World Bank data. This has been the case since 2011, for when the claim was made. Currently, China ($27.31 trillion) is the world's largest economy in terms of PPP, overtaking the United States ($22.99 trillion) in 2016.
BOOM has plotted the GDP PPP data for 2011 through 2021 for four countries: the United States, China, India and Japan. India has remained a constant third ($10.3 trillion in 2021) and Japan ($5.4 trillion in 2021) a constant fourth. The flip between the United States and China can be seen in 2016.
Therefore, unlike the claims made on social media, India has not "gone from" the third largest economy to 164th in the world in terms of growth as this comparison is absurd.
A caveat does apply, though. In a note, the World Bank does not recommend that PPP be used as a measure to strictly rank all economies or to measure national growth.
The World Bank data can be obtained from here.
2. What is GDP in constant prices?
An economy produces goods and services within its borders, and GDP measures it in money terms in a given time period, usually a year.
GDP in current prices measures these goods and services at the going market rate. However, this props up the problem of inter-period comparisons. The fact that there is no clear demarcation between inflation (price rise) and output (changes in goods and services) makes the comparison of GDP in current prices year-on-year tricky.
To provide a solution, GDP in constant prices therefore fixes the prices relative to one base year, therefore measuring only changes in output, in a process that adjusts for inflation. Therefore, if output increases year-on-year, GDP in constant prices will also increase, with this growth rate being comparable year-on-year. This base year is 2011 - 2012 in India.
The ranking of India's growth rate according to the graphic (164 out of 193) is in these constant prices terms, according to estimates released by the International Monetary Fund in its World Economic Outlook update in October 2020.
The estimates showed that the Indian economy was projected to contract 10.3% (implying that India's GDP would become 10.3% smaller) in 2020 (or financial year FY2021). This placed it 165th of 194 countries on the list (there are 195 countries on the list, but Syria had no estimates). The economy did end up contracted 7.3% in FY21.
However, these estimates are from nearly a year and a half ago. The latest estimates released by the IMF in April estimated India growing at 8.95% in FY22 (April 2021 to March 2022), as the 28th fastest growing economy in the world and the fastest growing large economy in the world.
Official estimates released by the Indian government did show India growing at 8.7% in this period.
However, these growth rates cannot be compared to economic size in terms PPP.
This article is republished from BOOM under a Creative Commons license. Read the original article.
2022-07-19T15:53:00+05:30