
AST SpaceMobile satellite placed into wrong orbit

Your smart home can be easily hacked. New safety standards will help, but stay vigilant
Yang Xiang, Swinburne University of Technology
On a quiet suburban street, a modern Australian home wakes before its owners do.
The lights turn on automatically, the thermostat adjusts to a comfortable temperature, and the coffee machine begins brewing. A doorbell camera watches the front yard, a baby monitor streams live footage to a parent’s phone, and a smart speaker waits for its next command.
This is the promise of the smart home: convenience, efficiency and peace of mind.
But behind this smooth experience is a hidden risk: every connected device can also be a way for cyber attackers to get in.
The Australian government has responded by introducing minimum security standards for smart devices to better protect households in this increasingly connected world.
These standards recently took effect. So what’s in them? And are they sufficient to keep people safe?
Starting with manufacturers
From my experience working in cybersecurity, I’ve seen that security risks start from manufacturers themselves.
Many smart devices are not designed with security as a priority. Manufacturers often focus on keeping costs low, releasing products quickly, and making them easy to use. Security is treated as an afterthought.
For example, many devices arrive with weak default passwords such as “admin” or “1234”, which users rarely change. This creates an easy opportunity for attackers to gain access.
The Mirai botnet attack in 2016 clearly demonstrated the risks. In this case, hundreds of thousands of insecure devices such as doorbell cameras were hijacked to launch massive “distributed denial-of-service” (DDoS) attacks. This is a type of cyber attack where many computers or devices are used together to overwhelm a website, server, or network with traffic, so it becomes slow or completely unavailable to legitimate users.
More recent research has shown smart home devices can be exploited not only to disrupt systems but also to spy on households. In some cases, strangers have accessed baby monitors, and poorly secured cameras have exposed private footage online.
Another major issue is the lack of regular software updates.
Many low-cost or older devices don’t receive ongoing security patches, which means known software vulnerabilities remain open indefinitely. Attackers actively scan the internet for such devices, exploiting weaknesses at a large scale. Cloud-connected and AI-enabled systems amplify risks.
The consequences of these weaknesses go beyond individual households. Compromised devices can be used as part of larger cyber attacks, forming botnets that target critical infrastructure or businesses.
In effect, an insecure smart lightbulb or camera can become a building block in global cyber crime operations.
What are the new standards?
In response to these growing threats, the Australian government has begun introducing mandatory minimum security standards for connected devices.
These standards took effect earlier this month. They aim to establish a baseline level of protection across all products entering the market.
While the details of these standards may evolve, the key ideas are clear.
First, devices must not use universal default passwords. Each device should either require users to create a unique password during setup or be shipped with a unique credential.
Second, manufacturers must provide a clear vulnerability disclosure policy, allowing security researchers to report issues responsibly.
Third, there must be transparency around how long a device will receive security updates, so consumers can make informed decisions.
These changes shift some responsibility from users to manufacturers. Instead of expecting consumers to fix security problems themselves, devices must be designed to be safer from the start.
In practice, this means fewer vulnerabilities and greater accountability across the industry.
Regulation alone isn’t enough
However, regulation alone is not enough. Household behaviour still plays a critical role in maintaining security. Fortunately, some of the most effective steps are simple.
Changing default passwords to strong, unique ones is one of the most important steps. A strong password should be long, complex and not reused across multiple devices or accounts.
Enabling multi-factor authentication wherever possible adds a second layer of defence, making it significantly harder for attackers to gain access.
Regularly updating device firmware, also known as “software for hardware”, is equally important. Firmware updates often include patches for newly discovered vulnerabilities, and delaying them leaves devices exposed.
Users should also consider their home network design. Placing smart devices on a separate network, such as a guest wifi, can help isolate them from more sensitive information on personal or work devices.
Finally, choosing reputable manufacturers matters. Companies with a strong track record of providing ongoing security updates and transparent policies are generally safer choices than unknown or low-cost alternatives.
Smart homes are becoming an integral part of everyday life, and their benefits continue to grow. But as intelligence and automation expand, convenience must not come at the expense of security and trust.
With stronger standards, better-designed devices and more informed users, it is possible to enjoy the benefits of smart homes without exposing ourselves to unnecessary cyber risks.![]()
Yang Xiang, Professor, Computer Science, Swinburne University of Technology
This article is republished from The Conversation under a Creative Commons license. Read the original article.
Franchise businesses have long been plagued by scandals. Domino’s is just the latest
Jenny Buchan, UNSW Sydney
The blue and red boxes with white dots are immediately recognisable as containing Domino’s pizzas. The pizza chain is Australia’s largest and is run as a franchise, with the ASX-listed public company Domino’s Pizza Enterprises holding the Australian master franchise rights.
Industry analysts IBISWorld calculate Domino’s has 4.2% of the fast food and takeaway market in Australia.
But recent reports suggest all is not well with many of the store owners, who are struggling with rising costs and declining profitability.
Troubling reports
The central issue appears to be what the federal government describes in its code of conduct as the “the imbalance of power between franchisors and franchisees”.
The Australian Financial Review has reported troubling claims in two key areas:
Domino’s appears to have doubled the margin on the key food ingredients it sells to franchisees and increased its advertising levy, according to a letter from store owners represented by the Australian Association of Franchisees. This could reduce their profitability
Domino’s Australian chief operating officer, Greg Steenson, reportedly encouraged franchisees in a presentation to take advantage of restructuring schemes that allow insolvent companies to continue to trade by negotiating repayment plans with the tax office and other creditors.
In a letter to Domino’s quoted in the report, the franchisees said their earnings have remained flat for 15 years, and have not kept up with inflation.
A long history of disputes
A former franchisee told a parliamentary inquiry into the franchising model the margin squeeze meant
franchisees can be ripped off by [Domino’s Pizza Enterprises] when forced to buy supplies at a higher price than they could get through their wholesalers.
He said the cost of food, labour, rent and other fixed costs had risen, but in 2019 pizzas were still sold at 1990s prices. “Nobody is left to pay for this but the franchisees,” the former owner said.
According to the Financial Review article, the cost of supplies remains a problem for franchisees. Time will tell whether Domino’s proposed 70 cent increase in pizza prices will help.
In response to questions from the Financial Review, Domino’s said the food margin had not “materially changed” in five years, despite volatility in ingredients prices.
Government reviews found the previous regulations had loopholes that did not sufficiently protect franchisees. There have been a string of high-profile disputes involving auto services company Ultra Tune, coffee chain 85 Degrees Coffee, Pizza Hut and others.
Following a 2024 inquiry, changes to the code of conduct were introduced this year.
Advertising costs on the rise
Advertising expenditure comes from what is now known as a “special purpose fund” in the code of conduct. Franchisors need to provide franchisees with disclosure about how the money is spent.
In 2017, the consumer regulator Australian Competition and Consumer Commission fined Domino’s A$18,000 for allegedly slipping on its obligations to advise franchisees about its marketing spend.
Ensuring franchisees have a genuine say in how their increased contribution is spent could help to address any imbalance of power between Domino’s and its franchisees.
Franchisees reportedly now pay 6% of their earnings to Domino’s for marketing and advertising, up from 5.35%. That is in addition to 7% of gross sales paid as royalties, and other costs for email and bookkeeping.
What insolvent means
The insolvency law for small businesses is explained by the Australian Taxation Office as a process that enables financially distressed but viable firms to restructure their existing debts and continue to trade.
The press reports say the franchisees of about 65 Domino’s stores were on repayment plans with the Australian Taxation Office. Many franchisees own two or more outlets.
Under the Corporations legislation, companies on these repayment plans may be trading insolvent, or believe they will become insolvent. Insolvent means they cannot pay their debts when they fall due. If this is the case, a key question that needs to be answered by Domino’s is whether their franchised outlets can become profitable.
In another media report, Domino’s was quoted as saying it disputed the number of stores on repayment plans, adding it was a “significantly smaller” number of franchisees.
The company was contacted for comment but did not respond before deadline.
What this means for the stores
So what does this mean for Domino’s store owners who may be trading insolvent?
Under the law, the restructuring process allows eligible small business companies:
- to retain control of the business, property and affairs while developing a plan to restructure with the assistance of a small business restructuring practitioner
- to enter into a restructuring plan with creditors.
If a company proposes a restructuring plan to its creditors, it is taken to be insolvent. This is a game changer for the franchisee and its creditors.
Franchisees receive protection from creditors who want to enforce rights under existing contracts. A franchisee’s creditors include suppliers, its landlord, employees, the tax office and the franchisor (in this case, Domino’s).
Currently these store owners are protected from any creditors pushing them to pay their debts. The restructuring process gives the store owners some breathing room while the debt negotiations take place.
The imbalance of power persists
Despite government inquiries and reviews, it seems the imbalance of power between the Domino’s franchisees and their franchisor persists.
But Domino’s can’t afford to stay the same. Franchisees need to make a profit. The move to enter restructuring could be a temporary band aid.
Domino’s largest shareholder and executive chairman, Jack Cowin, was appointed in July after the former chief executive left after just seven months. Cowin understands the franchised fast food sector and has pledged to lead a cost reduction program that will improve the profitability of stores.![]()
Jenny Buchan, Emeritus Professor, Business School, UNSW Sydney
This article is republished from The Conversation under a Creative Commons license. Read the original article.
HIV breakthrough stalled by red tape barriers in India
Rupee crashes to record low beyond 90 per dollar
The world’s carbon emissions continue to rise. But 35 countries show progress in cutting carbon
Global fossil fuel emissions are projected to rise in 2025 to a new all-time high, with all sources – coal, gas, and oil – contributing to the increase.
At the same time, our new global snapshot of carbon dioxide emissions and carbon sinks shows at least 35 countries have a plan to decarbonise. Australia, Germany, New Zealand and many others have shown statistically significant declines in fossil carbon emissions during the past decade, while their economies have continued to grow. China’s emissions have also been been growing at a much slower pace than recent trends and might even be flat by year’s end.
As world leaders and delegates meet in Brazil for the United Nations’ global climate summit, COP30, many countries that have submitted new emissions commitments to 2035 have shown increased ambition.
But unless these efforts are scaled up substantially, current global temperature trends are projected to significantly exceed the Paris Agreement target that aims to keep warming well below 2°C.
These 35 countries are now emitting less carbon dioxide even as their economies grow. Global Carbon Project 2025, CC BY-NC-NDFossil fuel emissions up again in 2025
Together with colleagues from 102 research institutions worldwide, the Global Carbon Project today releases the Global Carbon Budget 2025. This is an annual stocktake of the sources and sinks of carbon dioxide worldwide.
We also publish the major scientific advances enabling us to pinpoint the global human and natural sources and sinks of carbon dioxide with higher confidence. Carbon sinks are natural or artificial systems such as forests which absorb more carbon dioxide from the atmosphere than they release.
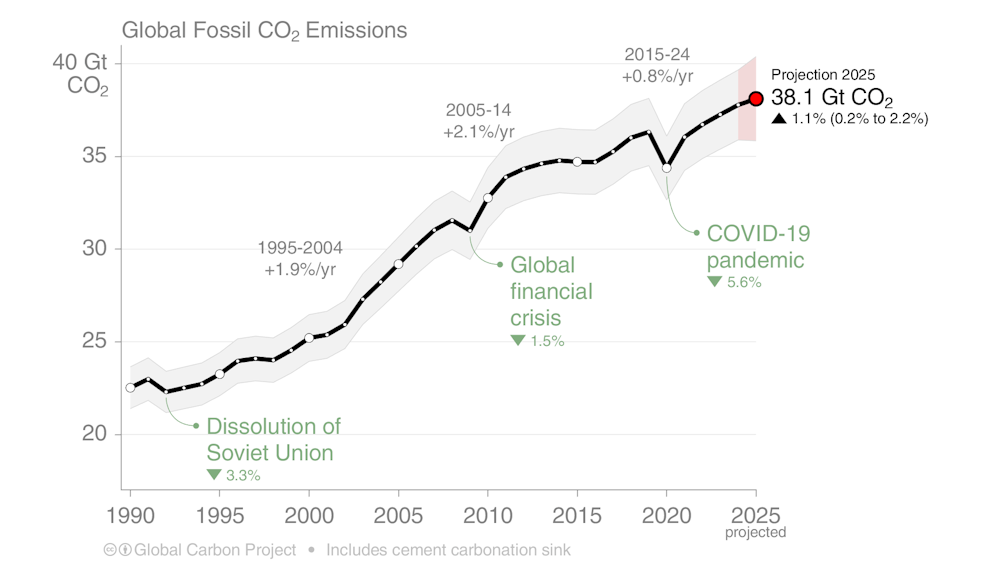
Global CO₂ emissions from the use of fossil fuels continue to increase. They are set to rise by 1.1% in 2025, on top of a similar rise in 2024. All fossil fuels are contributing to the rise. Emissions from natural gas grew 1.3%, followed by oil (up 1.0%) and coal (up 0.8%). Altogether, fossil fuels produced 38.1 billion tonnes of CO₂ in 2025.
Not all the news is bad. Our research finds emissions from the top emitter, China (32% of global CO₂ emissions) will increase significantly more slowly below its growth over the past decade, with a modest 0.4% increase. Emissions from India (8% of global) are projected to increase by 1.4%, also below recent trends.
However, emissions from the United States (13% of global) and the European Union (6% of global) are expected to grow above recent trends. For the US, a projected growth of 1.9% is driven by a colder start to the year, increased liquefied natural gas (LNG) exports, increased coal use, and higher demand for electricity.
EU emissions are expected to grow 0.4%, linked to lower hydropower and wind output due to weather. This led to increased electricity generation from LNG. Uncertainties in currently available data also include the possibility of no growth or a small decline.
Fossil fuel emissions hit a new high in 2025, but the growth rate is slowing and there are encouraging signs from countries cutting emissions. Global Carbon Project 2025, CC BY-NC-NDDrop in land use emissions
In positive news, net carbon emissions from changes to land use such as deforestation, degradation and reforestation have declined over the past decade. They are expected to produce 4.1 billion tonnes of carbon dioxide in 2025 down from the annual average of 5 billion tonnes over the past decade. Permanent deforestation remains the largest source of emissions. This figure also takes into account the 2.2 billion tonnes of carbon soaked up by human-driven reforestation annually.
Three countries – Brazil, Indonesia and the Democratic Republic of the Congo – contribute 57% of global net land-use change CO₂ emissions.
When we combine the net emissions from land-use change and fossil fuels, we find total global human-caused emissions will reach 42.2 billion tonnes of carbon dioxide in 2025. This total has grown 0.3% annually over the past decade, compared with 1.9% in the previous one (2005–14).
Carbon sinks largely stagnant
Natural carbon sinks in the ocean and terrestrial ecosystems remove about half of all human-caused carbon emissions. But our new data suggests these sinks are not growing as we would expect.
The ocean carbon sink has been relatively stagnant since 2016, largely because of climate variability and impacts from ocean heatwaves.
The land CO₂ sink has been relatively stagnant since 2000, with a significant decline in 2024 due to warmer El Niño conditions on top of record global warming. Preliminary estimates for 2025 show a recovery of this sink to pre-El Niño levels.
Since 1960, the negative effects of climate change on the natural carbon sinks, particularly on the land sink, have suppressed a fraction of the full sink potential. This has left more CO₂ in the atmosphere, with an increase in the CO₂ concentration by an additional 8 parts per million. This year, atmospheric CO₂ levels are expected to reach just above 425 ppm.
Tracking global progress
Despite the continued global rise of carbon emissions, there are clear signs of progress towards lower-carbon energy and land use in our data.
There are now 35 countries that have reduced their fossil carbon emissions over the past decade, while still growing their economy. Many more, including China, are shifting to cleaner energy production. This has led to a significant slowdown of emissions growth.
Existing policies supporting national emissions cuts under the Paris Agreement are projected to lead to global warming of 2.8°C above preindustrial levels by the end of this century.
This is an improvement over the previous assessment of 3.1°C, although methodological changes also contributed to the lower warming projection. New emissions cut commitments to 2035, for those countries that have submitted them, show increased mitigation ambition.
This level of expected mitigation falls still far short of what is needed to meet the Paris Agreement goal of keeping warming well below 2°C.
At current levels of emissions, we calculate that the remaining global carbon budget – the carbon dioxide still able to be emitted before reaching specific global temperatures (averaged over multiple years) – will be used up in four years for 1.5°C (170 gigatonnes remaining), 12 years for 1.7°C (525 Gt) and 25 years for 2°C (1,055 Gt).
Falling short
Our improved and updated global carbon budget shows the relentless global increase of fossil fuel CO₂ emissions. But it also shows detectable and measurable progress towards decarbonisation in many countries.
The recovery of the natural CO₂ sinks is a positive finding. But large year-to-year variability shows the high sensitivity of these sinks to heat and drought.
Overall, this year’s carbon report card shows we have fallen short, again, of reaching a global peak in fossil fuel use. We are yet to begin the rapid decline in carbon emissions needed to stabilise the climate.![]()
Pep Canadell, Chief Research Scientist, CSIRO Environment; Executive Director, Global Carbon Project, CSIRO; Clemens Schwingshackl, Senior Researcher in Climate Science, Ludwig Maximilian University of Munich; Corinne Le Quéré, Royal Society Research Professor of Climate Change Science, University of East Anglia; Glen Peters, Senior Researcher, Center for International Climate and Environment Research - Oslo; Judith Hauck, Helmholtz Young Investigator group leader and deputy head, Marine Biogeosciences section at the Alfred Wegener Institute, Universität Bremen; Julia Pongratz, Professor of Physical Geography and Land Use Systems, Department of Geography, Ludwig Maximilian University of Munich; Mike O'Sullivan, Lecturer in Mathematics and Statistics, University of Exeter; Pierre Friedlingstein, Chair, Mathematical Modelling of Climate, University of Exeter, and Robbie Andrew, Senior Researcher, Center for International Climate and Environment Research - Oslo
This article is republished from The Conversation under a Creative Commons license. Read the original article.
TPG suffers data breach impacting 280,000 customers

AI regulatory violations to push 30 pc rise in tech firms' legal disputes by 2028
Want more protein for less money? Don’t be fooled by the slick black packaging
If you’ve been supermarket shopping lately, you might have noticed more foods with big, bold protein claims on black packaging – from powders and bars to yoghurt, bread and even coffee.
International surveys show people are shopping for more protein because they think it’ll help their fitness and health. But clever marketing can sway our judgement too.
Before your next shop, here’s what you should know about how protein is allowed to be sold to us. And as a food and nutrition scientist, I’ll offer some tips for choosing the best value meat or plant-based protein for every $1 you spend – and no, protein bars aren’t the winner.
‘Protein’ vs ‘increased protein’ claims
Let’s start with those “high protein” or “increased protein” claims we’re seeing more of on the shelves.
In Australia and New Zealand, there are actually rules and nuances about how and when companies can use those phrases.
Under those rules, labelling a product as a “protein” product implies it’s a “source” of protein. That means it has at least 5 grams of protein per serving.
“High protein” doesn’t have a specific meaning in the food regulations, but is taken to mean “good source”. Under the rules, a “good source” should have at least 10 grams of protein per serving.
Then there is the “increased protein” claim, which means it has at least 25% more protein than the standard version of the same food.
If you see a product labelled as a “protein” version, you might assume it has significantly more protein than the standard version. But this might not be the case.
Take, for example, a “protein”-branded, black-wrapped cheese: Mini Babybel Protein. It meets the Australian and New Zealand rules of being labelled as a “source” of protein, because it has 5 grams of protein per serving (in this case, in a 20 gram serve of cheese).
But what about the original red-wrapped Mini Babybel cheese? That has 4.6g of protein per 20 gram serving.
The difference between the original vs “protein” cheese is not even a 10% bump in protein content.
Black packaging by design
Food marketers use colours to give us signals about what’s in a package.
Green signals natural and environmentally friendly, reds and yellows are often linked to energy, and blue goes with coolness and hydration.
These days, black is often used as a visual shorthand for products containing protein.
But it’s more than that. Research also suggests black conveys high-quality or “premium” products. This makes it the perfect match for foods marketed as “functional” or “performance-boosting”.
The ‘health halo’ effect
When one attribute of a food is seen as positive, it can make us assume the whole product is health-promoting, even if that’s not the case. This is called a “health halo”.
For protein, the glow of the protein halo can make us blind to the other attributes of the food, such as added fats or sugars. We might be willing to pay more too.
It’s important to know protein deficiency is rare in countries like Australia. You can even have too much protein.
How to spend less to get more protein
If you do have good reason to think you need more protein, here’s how to get better value for your money.
Animal-based core foods are nutritionally dense and high-quality protein foods. Meats, fish, poultry, eggs, fish, and cheese will have between 11 to 32 grams of protein per 100 grams.
That could give you 60g in a chicken breast, 22g in a can of tuna, 17g in a 170g tub of Greek yoghurt, or 12g in 2 eggs.
In the animal foods, chicken is economical, delivering more than 30g of protein for each $1 spent.
But you don’t need to eat animal products to get enough protein.
In fact, once you factor in costs – and I made the following calculations based on recent supermarket prices – plant-based protein sources become even more attractive.
Legumes (such as beans, lentils and soybeans) have about 9g of protein per 100g, which is about half a cup. Legumes are in the range of 20g of protein per dollar spent, which is a similar cost ratio to a protein powder.
Nuts and seeds like sunflower seeds can have 7g in one 30g handful. Even one cup of simple frozen peas will provide about 7g of protein.
Peanuts at $6 per kilogram supply 42g of protein for each $1 spent.
Dry oats, at $3/kg have 13g of protein per 100g (or 5g in a half cup serve), that’s 33g of protein per dollar spent.
In contrast, processed protein bars are typically poor value, coming in at between 6-8g of protein per $1 spent, depending on if you buy them in a single serve, or in a box of five bars.
Fresh often beats processed on price and protein
Packaged products offer convenience and certainty. But if you rely on convenience, colours and keywords alone, you might not get the best deals or the most nutritious choices.
Choosing a variety of fresh and whole foods for your protein will provide a diversity of vitamins and minerals, while reducing risks associated with consuming too much of any one thing. And it can be done without breaking the bank.![]()
Emma Beckett, Adjunct Senior Lecturer, Nutrition, Dietetics & Food Innovation - School of Health Sciences, UNSW Sydney
This article is republished from The Conversation under a Creative Commons license. Read the original article.
AI 171 crash preliminary report has found no mechanical or maintenance faults: Air India CEO
Tech Giants Slash 61,000 Jobs in 2025 AI Revolution

The global costs of the US-China tariff war are mounting. And the worst may be yet to come
The United States and China remain in a standoff in their tariff war. Neither side appears willing to budge.
After US President Donald Trump imposed massive 145% tariffs on Chinese imports in early April, China retaliated with its own tariffs of 125% on US goods.
US Treasury Secretary Scott Bessent said this week it’s up to China to de-escalate tensions. China’s Foreign Ministry, meanwhile, said the two sides are not talking.
The prospect of economic decoupling between the world’s two largest economies is no longer speculative. It is becoming a hard reality. While many observers debate who might “win” the trade war, the more likely outcome is that everyone loses.
A convenient target
Trump’s protectionist agenda has spared few. Allies and adversaries alike have been targeted by sweeping US tariffs. However, China has served as the main target, absorbing the political backlash of broader frustrations over trade deficits and economic displacement in the US.
The economic costs to China are undeniable. The loss of reliable access to the US market, coupled with mounting uncertainty in the global trading system, has dealt a blow to China’s export-driven sectors.
China’s comparative advantage lies in its vast manufacturing base and tightly integrated supply chains. This is especially true in high-tech and green industries such as electric vehicles, batteries and solar energy. These sectors are deeply dependent on open markets and predictable demand.
New trade restrictions in Europe, Canada and the US on Chinese electric vehicles, in particular, have already caused demand to drop significantly.
China’s GDP growth was higher than expected in the first quarter of the year at 5.4%, but analysts expect the effect of the tariffs to soon bite. A key measure of factory activity this week showed a contraction in manufacturing.
China’s economic growth has also been weighed down by structural headwinds, including industrial overcapacity (when a country’s production of goods exceeds demand), an ageing population, rising youth unemployment and persistent regional disparities. The property sector — once a pillar of the country’s economic rise — has become a source of financial stress. Local government debt is mounting and a pension crisis is looming.
Negotiations with the US might be desirable to end the tariff war. However, unilateral concessions on Beijing’s part are neither viable nor politically palatable.
Regional coordination
Trump’s tariff wars have done more than strain bilateral relationships; they have shaken the foundations of the global trading system.
By sidelining the World Trade Organization and embracing a transactional approach to bilateral trade, the US has weakened multilateral norms and emboldened protectionist tendencies worldwide.
One unintended consequence of this instability has been the resurgence of regional arrangements. In Asia, the Regional Comprehensive Economic Partnership (RCEP), backed by China and centred on the ASEAN bloc in Southeast Asia, has emerged as a credible alternative for economic cooperation.
Meanwhile, the Comprehensive and Progressive Agreement for Trans-Pacific Partnership (CPTPP) continues to expand, with the United Kingdom joining late last year.
Across Latin America, too, regional blocs are exploring new avenues for integration, hoping to buffer themselves against the shocks of resurgent protectionism.
But regionalism is no panacea. It cannot replicate the scale or efficiency of global trade, nor can it restore the predictability on which exporters depend.
Looming dangers
The greater danger is the world drifting into a Kindleberger Trap — a situation in which no power steps forward to provide the leadership necessary to sustain global public goods, or a stable trading system.
Economist Charles Kindleberger’s account of the Great Depression remains instructive: it was not the presence of conflict but the absence of leadership that brought about the global economy’s systemic collapse.
Without renewed global coordination, the economic fragmentation triggered by Trump’s tariff wars could give way to something far more dangerous than a recession – rising geopolitical and military tensions that no region can contain.
The political landscape is already fraught. The Chinese Communist Party, for instance, has long tethered its legitimacy to the promise of eventual unification with Taiwan. Yet the costs of using force remain prohibitively high.
Taiwanese President Lai Ching-te’s recent designation of China as a “foreign hostile force” have sharpened tensions. Beijing’s response has been calibrated – military exercises intended more as a warning than a prelude to conflict.
However, the intensifying trade war with the US may become the final straw that exhausts Beijing’s patience, leaving Taiwan as collateral damage in a US-China final showdown.
A role for collective leadership
China alone is neither able nor inclined to assume the mantle of global leadership. Its current focus is more on domestic priorities – sustaining economic growth and managing social stability – than on foreign policy.
Yet, Beijing can still play a constructive role in shaping the international environment through its cooperation with Europe, ASEAN and the Global South.
The objective is not to replace American hegemony, but to support a more multi-polar and collaborative system — one capable of sustaining global public goods in an era of uncertainty.
Paradoxically, a more coordinated effort by the rest of the world may ultimately help bring the US back into the fold. Washington may rediscover the strategic value of engagement — and return not as the sole leader, but as an indispensable partner.
In the short term, other states may seek to gain an advantage from the great power standoff. But they should remember that what begins as a clash between giants can quickly engulf bystanders.
In this volatile landscape, the path forward does not lie in exploiting disorder. Rather, nations must cautiously advance the shared interest in restoring a stable, rules-based global order.![]()
Kai He, Professor of International Relations, Griffith University
This article is republished from The Conversation under a Creative Commons license. Read the original article.
How common are errors in IVF labs? Can they be prevented?
The news of a woman unknowingly giving birth to another patient’s baby after an embryo mix-up at a Brisbane IVF lab has made headlines in Australia and around the world. The distress this incident will have caused to everyone involved is undoubtedly significant.
A report released by Monash IVF, the company which operates the Brisbane clinic, states it “adheres to strict laboratory safety measures (including multi-step identification processes) to safeguard and protect the embryos in its care”.
It also says the company’s own initial investigation concluded the incident was “the result of human error”.
An independent investigation will follow which presumably will shed light on how human error could occur when multi-step identification processes are in place.
On a broader level, this incident raises questions about how common IVF errors are and to what extent they’re preventable.
The booming IVF industry
Because people have children later in life than they used to, some struggle to conceive and turn to assisted reproductive technologies. These include in-vitro fertilisation (IVF) and intracytoplasmic sperm injection (ICSI) which both involve handling of sperm and eggs (gametes) in the laboratory to form embryos. If there’s more than one embryo available after a treatment cycle, they can be frozen and stored for later use.
Increasingly, assisted reproductive technologies are also being used by single women, same-sex couples, and women who freeze their eggs to preserve their fertility.
For these reasons, the fertility industry is booming. In 2022 there were more than 100,000 assisted reproductive treatment cycles performed in Australian fertility clinics, up more than 25% on the number of cycles performed in 2017.
Regulation of the IVF industry
In Australia, the IVF industry is more regulated than in many other parts of the world.
To operate, clinics must be licensed by the Reproductive Technology Accreditation Committee and adhere to its code of practice.
In relation to storage and accurate identification of embryos, the code states clinics must provide evidence of the implementation and review of:
Policies and procedures to identify when, how and by whom the identification, matching, and verification are recorded for gametes, embryos and patients at all stages of the treatment process including digital and manual record-keeping.
The code further states clinics must report serious adverse events to the Reproductive Technology Accreditation Committee. The list of what’s considered a serious adverse event includes any incident that “arises from a gamete or embryo identification mix up”.
Clinics must also adhere to the National Health and Medical Research Council’s ethical guidelines on the use of reproductive technology in clinical practice and research.
Lastly, states and territories have laws that regulate aspects of the IVF industry such as requirements to report adverse events and other data to state authorities.
In the United Kingdom, the Human Fertilisation and Embryology Authority regulates the IVF industry and requires clinics to report adverse incidents. These are reported as grade A, B or C, where A is the most serious and involves “severe harm to one person, or major harm to many”. Data on adverse incidents is reported in a publicly available annual report.
In the United States, however, the IVF industry is largely unregulated, and clinics don’t have to report adverse incidents. However, the American Society for Reproductive Medicine states clinics should have rigorous procedures to prevent the loss, damage, or misdirection of gametes and embryos and have an ethical obligation to disclose errors to all impacted patients.
How common are IVF errors?
There’s no global data on IVF errors so it’s not possible to know how common they are. But we learn about some of the more serious incidents when they’re reported in the media.
While the recent embryo mix-up is the first known incident of this nature in Australia’s 40-year IVF history, we have seen reports of other errors in Australian clinics. These include the alleged use of the wrong donor sperm, embryos being destroyed due to contamination, and inaccurate genetic testing which resulted in the destruction of potentially viable embryos.
In the UK, the Human Fertilisation and Embryology Authority’s most recent report states there was one Grade A incident in 2023–24. This was the first Grade A incident reported since 2019–20 when there were two.
In the US, some notable errors include storage tank malfunctions in two clinics which destroyed thousands of eggs and embryos.
Lawsuits have also been filed for embryo mix-ups. In a 2023 case, a woman from Georgia delivered a Black baby even though she and her sperm donor are both white. The biological parents subsequently demanded custody of the child. Despite wanting to raise him the woman who had given birth gave up the five-month-old boy to avoid a legal fight she couldn’t win, she said.
In the US, some argue most errors go unreported because reporting is not mandated and due to the absence of meaningful regulation.
Are IVF errors preventable?
Despite Australia’s stringent regulation and oversight of the IVF industry, an incident with far-reaching psychological and potentially legal consequences has occurred.
Until the independent investigation reveals how “human error” caused this mix-up, it’s not possible to say what additional measures Monash IVF should take to ensure this never happens again.
An IVF laboratory is a high-pressure environment, and any investigation should look at whether staffing levels are adequate. Staff training is also relevant, and it’s essential all junior lab staff have adequate supervision.
Finally, perhaps Australia should adopt the UK’s model and make data about adverse events reported to the Reproductive Technology Accreditation Committee available to the public in an annual report. To reassure the public, this report could include what measures clinics take to avoid the errors happening again.![]()
Karin Hammarberg, Adjunct Senior Research Fellow, Global and Women's Health, School of Public Health & Preventive Medicine, Monash University
This article is republished from The Conversation under a Creative Commons license. Read the original article.
Australia’s fertility rate has reached a record low. What might that mean for the economy?
Australia’s fertility rate has fallen to a new record low of 1.5 babies per woman. That’s well below the “replacement rate” of 2.1 needed to sustain a country’s population.
On face value, it might not seem like a big deal. But we can’t afford to ignore this issue. The health of an economy is deeply intertwined with the size and structure of its population.
Australians simply aren’t having as many babies as they used to, raising some serious questions about how we can maintain our country’s workforce, sustain economic growth and fund important services.
So what’s going on with fertility rates here and around the world, and what might it mean for the future of our economy? What can we do about it?
Are lower birth rates always a problem?
Falling fertility rates can actually have some short-term benefits. Having fewer dependent young people in an economy can increase workforce participation, as well as boost savings and wealth.
Smaller populations can also benefit from increased investment per person in education and health.
But the picture gets more complex in the long term, and less rosy. An ageing population can strain pensions, health care and social services. This can hinder economic growth, unless it’s offset by increased productivity.
Other scholars have warned that a falling population could stifle innovation, with fewer young people meaning fewer breakthrough ideas.
A global phenomenon
The trend towards women having fewer children is not unique to Australia. The global fertility rate has dropped over the past couple of decades, from 2.7 babies per woman in 2000 to 2.4 in 2023.
However, the distribution is not evenly spread. In 2021, 29% of the world’s babies were born in sub-Saharan Africa. This is projected to rise to 54% by 2100.
There’s also a regional-urban divide. Childbearing is often delayed in urban areas and late fertility is more common in cities.
In Australia, we see higher fertility rates in inner and outer regional areas than in metro areas. This could be because of more affordable housing and a better work-life balance.
But it raises questions about whether people are moving out of cities to start families, or if something intrinsic about living in the regions promotes higher birth rates.
Fewer workers, more pressure on services
Changes to the makeup of a population can be just as important as changes to its size. With fewer babies being born and increased life expectancy, the proportion of older Australians who have left the workforce will keep rising.
One way of tracking this is with a metric called the old-age dependency ratio – the number of people aged 65 and over per 100 working-age individuals.
In Australia, this ratio is currently about 27%. But according to the latest Intergenerational Report, it’s expected to rise to 38% by 2063.
An ageing population means greater demand for medical services and aged care. As the working-age population shrinks, the tax base that funds these services will also decline.
What about housing?
It’s tempting to think a falling birth rate might be good news for Australia’s stubborn housing crisis.
The issues are linked – rising real estate prices have made it difficult for many young people to afford homes, with a significant number of people in their 20s still living with their parents.
This can mean delaying starting a family and reducing the number of children they have.
At the same time, if fertility rates stay low, demand for large family homes may decrease, impacting one of Australia’s most significant economic sectors and sources of household wealth.
Can governments turn the tide?
Governments worldwide, including Australia, have long experimented with policies that encourage families to have more children. Examples include paid parental leave, childcare subsidies and financial incentives, such as Australia’s “baby bonus”.
Many of these efforts have had only limited success. One reason is the rising average age at which women have their first child. In many developed countries, including Australia, the average age for first-time mothers has surpassed 30.
As women delay childbirth, they become less likely to have multiple children, further contributing to declining birth rates. Encouraging women to start a family earlier could be one policy lever, but it must be balanced with women’s growing workforce participation and career goals.
Research has previously highlighted the factors influencing fertility decisions, including levels of paternal involvement and workplace flexibility. Countries that offer part-time work or maternity leave without career penalties have seen a stabilisation or slight increases in fertility rates.
The way forward
Historically, one of the ways Australia has countered its low birth rate is through immigration. Bringing in a lot of people – especially skilled people of working age – can help offset the effects of a low fertility rate.
However, relying on immigration alone is not a long-term solution. The global fertility slump means that the pool of young, educated workers from other countries is shrinking, too. This makes it harder for Australia to attract the talent it needs to sustain economic growth.
Australia’s record-low fertility rate presents both challenges and opportunities. On one hand, the shrinking number of young people will place a strain on public services, innovation and the labour market.
On the other hand, advances in technology, particularly in artificial intelligence and robotics, may help ease the challenges of an ageing population.
That’s the optimistic scenario. AI and other tech-driven productivity gains could reduce the need for large workforces. And robotics could assist in aged care, lessening the impact of this demographic shift.![]()
Jonathan Boymal, Associate Professor of Economics, RMIT University; Ashton De Silva, Professor of Economics, RMIT University, and Sarah Sinclair, Senior Lecturer in Economics, RMIT University
This article is republished from The Conversation under a Creative Commons license. Read the original article.
The Conversation, 