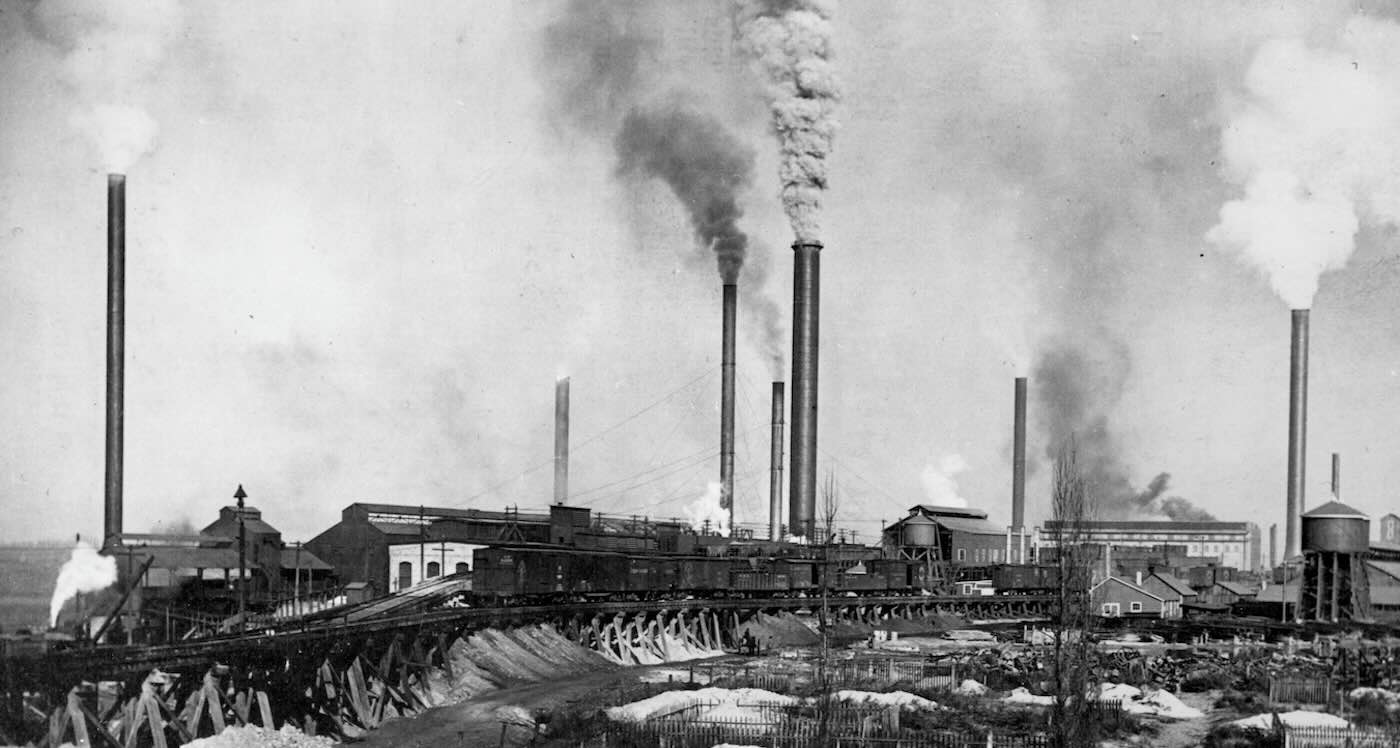
The world’s carbon emissions continue to rise. But 35 countries show progress in cutting carbon

Global fossil fuel emissions are projected to rise in 2025 to a new all-time high, with all sources – coal, gas, and oil – contributing to the increase.

At the same time, our new global snapshot of carbon dioxide emissions and carbon sinks shows at least 35 countries have a plan to decarbonise. Australia, Germany, New Zealand and many others have shown statistically significant declines in fossil carbon emissions during the past decade, while their economies have continued to grow. China’s emissions have also been been growing at a much slower pace than recent trends and might even be flat by year’s end.

As world leaders and delegates meet in Brazil for the United Nations’ global climate summit, COP30, many countries that have submitted new emissions commitments to 2035 have shown increased ambition.

But unless these efforts are scaled up substantially, current global temperature trends are projected to significantly exceed the Paris Agreement target that aims to keep warming well below 2°C.

These 35 countries are now emitting less carbon dioxide even as their economies grow. Global Carbon Project 2025, CC BY-NC-ND

Fossil fuel emissions up again in 2025

Together with colleagues from 102 research institutions worldwide, the Global Carbon Project today releases the Global Carbon Budget 2025. This is an annual stocktake of the sources and sinks of carbon dioxide worldwide.

We also publish the major scientific advances enabling us to pinpoint the global human and natural sources and sinks of carbon dioxide with higher confidence. Carbon sinks are natural or artificial systems such as forests which absorb more carbon dioxide from the atmosphere than they release.

Global CO₂ emissions from the use of fossil fuels continue to increase. They are set to rise by 1.1% in 2025, on top of a similar rise in 2024. All fossil fuels are contributing to the rise. Emissions from natural gas grew 1.3%, followed by oil (up 1.0%) and coal (up 0.8%). Altogether, fossil fuels produced 38.1 billion tonnes of CO₂ in 2025.

Not all the news is bad. Our research finds emissions from the top emitter, China (32% of global CO₂ emissions) will increase significantly more slowly below its growth over the past decade, with a modest 0.4% increase. Emissions from India (8% of global) are projected to increase by 1.4%, also below recent trends.

However, emissions from the United States (13% of global) and the European Union (6% of global) are expected to grow above recent trends. For the US, a projected growth of 1.9% is driven by a colder start to the year, increased liquefied natural gas (LNG) exports, increased coal use, and higher demand for electricity.

EU emissions are expected to grow 0.4%, linked to lower hydropower and wind output due to weather. This led to increased electricity generation from LNG. Uncertainties in currently available data also include the possibility of no growth or a small decline.

Fossil fuel emissions hit a new high in 2025, but the growth rate is slowing and there are encouraging signs from countries cutting emissions. Global Carbon Project 2025, CC BY-NC-ND

Drop in land use emissions

In positive news, net carbon emissions from changes to land use such as deforestation, degradation and reforestation have declined over the past decade. They are expected to produce 4.1 billion tonnes of carbon dioxide in 2025 down from the annual average of 5 billion tonnes over the past decade. Permanent deforestation remains the largest source of emissions. This figure also takes into account the 2.2 billion tonnes of carbon soaked up by human-driven reforestation annually.

Three countries – Brazil, Indonesia and the Democratic Republic of the Congo – contribute 57% of global net land-use change CO₂ emissions.

When we combine the net emissions from land-use change and fossil fuels, we find total global human-caused emissions will reach 42.2 billion tonnes of carbon dioxide in 2025. This total has grown 0.3% annually over the past decade, compared with 1.9% in the previous one (2005–14).

Carbon sinks largely stagnant

Natural carbon sinks in the ocean and terrestrial ecosystems remove about half of all human-caused carbon emissions. But our new data suggests these sinks are not growing as we would expect.

The ocean carbon sink has been relatively stagnant since 2016, largely because of climate variability and impacts from ocean heatwaves.

The land CO₂ sink has been relatively stagnant since 2000, with a significant decline in 2024 due to warmer El Niño conditions on top of record global warming. Preliminary estimates for 2025 show a recovery of this sink to pre-El Niño levels.

Since 1960, the negative effects of climate change on the natural carbon sinks, particularly on the land sink, have suppressed a fraction of the full sink potential. This has left more CO₂ in the atmosphere, with an increase in the CO₂ concentration by an additional 8 parts per million. This year, atmospheric CO₂ levels are expected to reach just above 425 ppm.

Tracking global progress

Despite the continued global rise of carbon emissions, there are clear signs of progress towards lower-carbon energy and land use in our data.

There are now 35 countries that have reduced their fossil carbon emissions over the past decade, while still growing their economy. Many more, including China, are shifting to cleaner energy production. This has led to a significant slowdown of emissions growth.

Existing policies supporting national emissions cuts under the Paris Agreement are projected to lead to global warming of 2.8°C above preindustrial levels by the end of this century.

This is an improvement over the previous assessment of 3.1°C, although methodological changes also contributed to the lower warming projection. New emissions cut commitments to 2035, for those countries that have submitted them, show increased mitigation ambition.

This level of expected mitigation falls still far short of what is needed to meet the Paris Agreement goal of keeping warming well below 2°C.

At current levels of emissions, we calculate that the remaining global carbon budget – the carbon dioxide still able to be emitted before reaching specific global temperatures (averaged over multiple years) – will be used up in four years for 1.5°C (170 gigatonnes remaining), 12 years for 1.7°C (525 Gt) and 25 years for 2°C (1,055 Gt).

Falling short

Our improved and updated global carbon budget shows the relentless global increase of fossil fuel CO₂ emissions. But it also shows detectable and measurable progress towards decarbonisation in many countries.

The recovery of the natural CO₂ sinks is a positive finding. But large year-to-year variability shows the high sensitivity of these sinks to heat and drought.

Overall, this year’s carbon report card shows we have fallen short, again, of reaching a global peak in fossil fuel use. We are yet to begin the rapid decline in carbon emissions needed to stabilise the climate.The Conversation

Pep Canadell, Chief Research Scientist, CSIRO Environment; Executive Director, Global Carbon Project, CSIRO; Clemens Schwingshackl, Senior Researcher in Climate Science, Ludwig Maximilian University of Munich; Corinne Le Quéré, Royal Society Research Professor of Climate Change Science, University of East Anglia; Glen Peters, Senior Researcher, Center for International Climate and Environment Research - Oslo; Judith Hauck, Helmholtz Young Investigator group leader and deputy head, Marine Biogeosciences section at the Alfred Wegener Institute, Universität Bremen; Julia Pongratz, Professor of Physical Geography and Land Use Systems, Department of Geography, Ludwig Maximilian University of Munich; Mike O'Sullivan, Lecturer in Mathematics and Statistics, University of Exeter; Pierre Friedlingstein, Chair, Mathematical Modelling of Climate, University of Exeter, and Robbie Andrew, Senior Researcher, Center for International Climate and Environment Research - Oslo

This article is republished from The Conversation under a Creative Commons license. Read the original article.

Read More........

World's richest 10% caused two thirds of global warming: study


The world's wealthiest 10 percent of individuals are responsible for two thirds of global warming since 1990, researchers said on Wednesday.

How the rich consume and invest has substantially increased the risk of deadly heatwaves and drought, they reported in the first study to quantify the impact of concentrated private wealth on extreme climate events.

"We link the carbon footprints of the wealthiest individuals directly to real-world climate impacts," lead author Sarah Schoengart, a scientist at ETH Zurich, told AFP.

"It's a shift from carbon accounting toward climate accountability."

Compared to the global average, for example, the richest one percent contributed 26 times more to once-a-century heatwaves, and 17 times more to droughts in the Amazon, according to the findings, published in Nature Climate Change.

Emissions from the wealthiest 10 percent in China and the United States which together account for nearly half of global carbon pollution each led to a two-to-threefold rise in heat extremes.

Burning fossil fuels and deforestation have heated Earth's average surface by 1.3 degrees Celsius, mostly during the last 30 years.

Schoengart and colleagues combined economic data and climate simulations to trace emissions from different global income groups and assess their impact on specific types of climate-enhance extreme weather.

The researchers also emphasised the role of emissions embedded in financial investment rather than just lifestyle and personal consumption.

"Climate action that doesn't address the outsized responsibilities of the wealthiest members of society risk missing one of the most powerful levers we have to reduce future harm," said senior author Carl-Friedrich Schleussner, head of the Integrated Climate Impacts Research Group at the International Institute for Applied Systems Analysis near Vienna.

- Billionaires tax -

Owners of capital, he noted, could be held accountable for climate impacts through progressive taxes on wealth and carbon-intensive investments.

Earlier research has shown that taxing asset-related emissions is more equitable than broad carbon taxes, which tend to burden those on lower incomes.

Recent initiatives to increase taxes on the super-rich and multinationals have mostly stalled, especially since Donald Trump regained the White House.

Last year, Brazil -- as host of the G20 -- pushed for a two-percent tax on the net worth of individuals with more than $1 billion in assets.

Although G20 leaders agreed to "engage cooperatively to ensure that ultra-high-net-worth individuals are effectively taxed," there has been no follow-up to date.

In 2021, nearly 140 countries agreed on work toward a global corporate tax for multinational companies, with nearly half endorsing a minimum rate of 15 percent, but those talks have stalled as well.

Almost a third of the world's billionaires are from the United States more than China, India and Germany combined, according to Forbes magazine.

According to anti-poverty NGO Oxfam, the richest 1 percent have accumulated $42 trillion in new wealth over the past decade.

It says the richest one percent have more wealth than the lowest 95 percent combined.

Read More........

Improvement in air quality with decline in pollution levels in India: World Air Quality Report


New Delhi, (IANS) The World Air Quality Report 2024 by Swiss air quality technology company IQAir reveals a positive trend in India’s air quality, despite ongoing challenges.

According to the report, India now ranks as the fifth most polluted country globally in 2024, a notable improvement from its third-place ranking in 2023.

The country also recorded a 7 per cent decline in PM2.5 concentrations, which dropped from 54.4 micrograms per cubic metre in 2023 to 50.6 micrograms per cubic metre in 2024.

While 13 of the world’s 20 most polluted cities are in India, including Byrnihat, Delhi, and Faridabad, this decline signals a step in the right direction for addressing air pollution.

Delhi, which remains the most polluted capital city in the world, saw little change in its air quality, with an annual PM2.5 concentration of 91.6 micrograms per cubic metre in 2024, almost identical to 92.7 in 2023.

Despite these challenges, India’s progress in reducing air pollution is noteworthy. The decline in PM2.5 levels indicates that the country is making strides in combating air pollution, thanks to various measures aimed at improving air quality. These efforts include improving data collection on air quality, expanding cleaner energy solutions, and enhancing public transportation networks.

However, experts such as former WHO chief scientist and health ministry advisor Soumya Swaminathan emphasise the need for continued and increased action to combat air pollution.

Swaminathan suggests that solutions such as promoting the use of LPG over biomass, expanding public transport, and providing stronger subsidies for low-income families could further reduce pollution and improve public health.

While air pollution remains a significant health concern, with an estimated 1.5 million deaths annually linked to PM2.5 exposure, India’s efforts to reduce pollution are making a positive impact. The decline in PM2.5 concentrations is a promising development, and continued action will be essential to achieve even cleaner air for all.With these efforts in place, India is heading toward improving its air quality and reducing the health risks associated with air pollution, providing hope for a healthier future. Improvement in air quality with decline in pollution levels in India: World Air Quality Report | MorungExpress | morungexpress.com
Read More........